
Introduction
In our first outlook for 2022, we expected economies to shift from an acceleration phase to a moderation phase with higher market volatility, larger and more frequent drawdowns and lower expected returns.
The 4Rs: Russia, rates, risk, and recession are on investors’ minds as markets continue their volatility due to:
- Trade frictions
- Supply chain issues
- Elevated commodity prices
- Tight labor markets and expensive servicesIncreasingly hawkish central banks are sending mixed signals to global economies, affecting consumer and investor sentiment.
Inflation in May reached 8.6% year-on-year, its highest since 1981. The Federal Reserve (the “Fed”) raised rates by 0.75%, the biggest hike since 1994.
Growth estimates are being reevaluated. Several institutions, including the International Monetary Fund (IMF) are reducing growth forecasts.
Global Overview
Main indices year to June 2022 performance
The semi-annual performance of various indices so far is among the worst on record.
 Source: Bloomberg
GDP growth estimates have been reduced
Sustained inflation and the Ukraine-Russia conflict have slowed global economic growth from an estimated 6.1% in 2021 to 3.6% in 2022 and 2023. These forecasts are 0.8% and 0.2% below the January projections for 2022 and 2023, respectively.
 Source: THE IMF
High inflation is the main catalyst behind markets underperformance

 Sources: FRED,BLOOMBERG
And supply chain issues remain

 Source: BLOOMBERG
High inflation is pushing the central bank to tighten policy
Previous rate hikes lasted 24 months on average, with an average increase of 3%. While some tightening cycles lasted 14 months (e.g. May 1999), others lasted as long as 46 months (March 2015). Rate hikes may continue until Q4 2023, reaching 3% to 4% if inflation remained elevated.
 Source: FRED
A tightening policy is matched by higher yields
While interest rates have increased, the spread between two-year and 10-year treasury rate signals market uncertainty in the short term.
 Source: BLOOMBERG
While the yield curve might be inverting
 Source: BLOOMBERG
Potential reasons for further downside
Indicators, including the yield curve inversion, indicate further downside.
Inverted yield curve An inverted (negative) yield curve occurs when longer-term yields drop below short-term ones for debt of the same credit quality. An inverted curve has been a relatively reliable lead indicator of a recession.
High inflation Rising prices reduce consumer purchasing power leading to reduced spending.
Low ISM Manufacturing Index The ISM manufacturing index is a key monthly indicator of U.S. economic activity based on a survey of purchasing managers at more than 300 manufacturing firms. The index measures demand based on ordering activity at the nation's factories.
Geo-political uncertainty The Russian-Ukrainian conflict has a severe impact on the global economy, creating forced population displacement, higher commodity prices (including energy), and a global supply chain disruption.
Other indicators show signs of relief
Economic data such as unemployment and the Case Shiller index are encouraging
Strong labor market US unemployment in May 2022 was unchanged from the previous two months at 3.6%, down from 3.9% in May 2021 and the lowest since February 2020. Meanwhile, the labor force participation rate edged up to 62.3% from a three-month low of 62.2% in April.
Resilient housing market June 2022 S&P CoreLogic Case-Shiller Indices, the leading measure of U.S. home prices, continue to show rising home prices across the U.S. The S&P CoreLogic Case-Shiller U.S. National Home Price NSA Index, covering all nine U.S. census divisions, reported a 20.6% annual gain for March 2022.
Positive PMI The Manufacturing Purchasing Managers’ Index (PMI) is an indicator of business activity in the manufacturing sector, providing information about current and future business conditions. In June, the PMI index was 52.70. A score greater than 50 indicates an expansionary economy while a score below 50 forecasts a sluggish economy.
Credit market spreads The option-adjusted spread (OAS) on the S&P U.S. High-Yield Index, a measure of the risk premium demanded for high-yield bonds, rose more than 2.50% from the start of the year to 5.6%. However, average spreads were much higher in previous recessions and the OAS is still just below its 25-year average.
Strong indicators belie gaps under the surface
Despite low unemployment, the rise in part-time employees for economic reasons may foreshadow a looming weakness in labor markets. A similar divergence with unemployment occurred before the global financial crisis.
 Source: BLOOMBERG
Fundamentals
Managing bull and bear cycles
Identifying the relevant cycle and positioning the portfolio accordingly help reduce losses and improve risk management in bear cycles while capturing a better upside in bull cycles. Recession and cyclical bear markets tend to last less than post-recession and post-cyclical bull markets. Since 1968, the recession and cyclical bear markets averaged 528 days and 207 days, respectively, while post-recession and post-cyclical bull markets averaged 563 days and 1064 days, respectively. Source: BLOOMBERG
The correction has not yet factored lower anticipated earnings
Lower earnings are expected due to higher labor and raw material cost amidst supply chain bottlenecks.
 Source: BLOOMBERG
The correction has not yet factored lower anticipated earnings
In previous recessions, corporate profits and consumer sentiment fell in tandem, which has yet to happen. However, the gap should close when corporate profits are negatively impacted.
 Source: BLOOMBERG
S&P 500 has record earnings
Although S&P 500 earnings are at all-time records, a recession can trigger significant drops in profitability.
 Source: BLOOMBERG
Private markets outperform public ones during major slowdowns
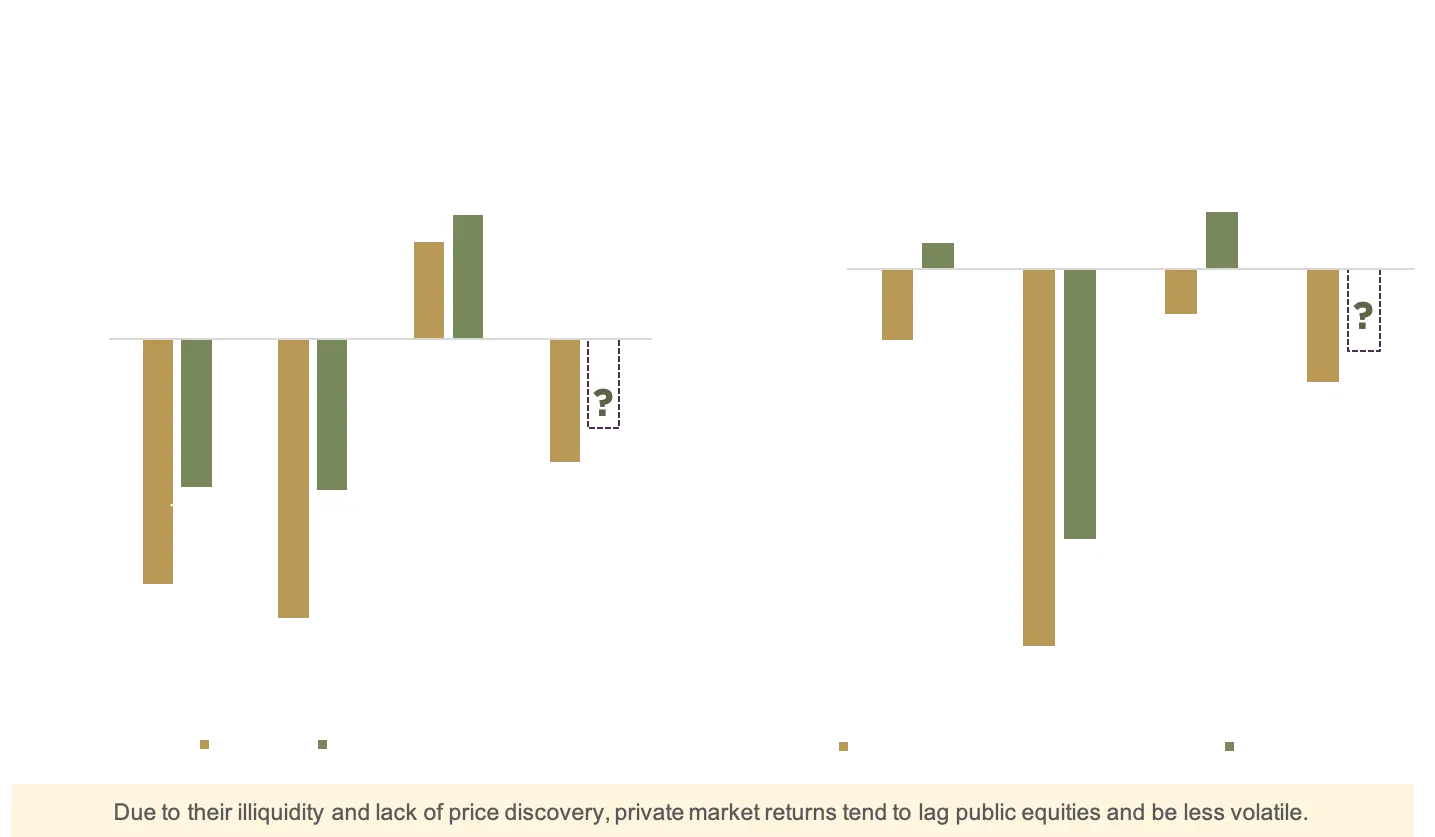 Source: Private Equity / Real Estate returns from Cambridge Associates. S&P500 / Dow Jones Equity REIT Index from Bloomberg
Despite record profits and lower valuations, further downside is expected
Reduced valuations in public markets, notably the S&P 500, may drop further after earning revisions. In previous inflationary environments where CPI exceeded 3%, the median and average correction in price to earnings (P/E) were 20% and 30%, respectively. The S&P P/E was around 22.0x when the Fed started hiking rates in March 2022, which might indicate further downside as earnings are revised
 Source: Bloomberg
The credit market tells a different story
When bond prices drop, the high-yield spread tends to widen. Although the option-adjusted spread (OAS) has widened, the readings remain far below those in previous recessions. This indicates either that the credit market is near the bottom after the high-yield index fell as much as 14.19%, or that credit spreads are still catching up. The High-Yield OAS is slightly below its 25-year average of 5.43%
 Source: Bloomberg
Labor and housing markets show encouraging signs.
Could corporate profits still rise to record highs despite worrisome macro events? Source: Yield Curve: 10 2Yr differential: US Personal Consumer Expenditure YoY . Labor: U.S. Unemployment %. Credit Performance: U.S. High yield spreads. ISM MFG: U.S. PMI. Earnings: S&P YoY Earnings growth. Housing: U.S. House Price Index.
Sentiment
Investors consider central banks the biggest “tail risk” this year
 Source: Bank of America Global Fund Manager Survey
Investor sentiment
The Fear and Greed Index (which uses seven factors including market momentum, safe-haven demand, and junk bond demand) showed fear at 29 as of June 28, 2022. Although sentiment has fallen significantly since the start of the year, it has improved from extreme fear conditions, implying that there is no market capitulation yet.
 Source: CNN
Consumer and corporate sentiment
 Source: Bloomberg
What this mean to your portfolio
Potential medium-term scenarios
Four potential medium-term scenarios can define the next market cycle. Each scenario impacts your portfolio differently.
 Market cycles and positions
A two-phase plan is underway
Phase I
Take advantage of market dislocations in liquid assets during the bear market phase, focusing on high-yield/loan credit and banks
Phase II
Take advantage of market dislocations in illiquid assets during the recovery phase
 Conclusion
Low investor and consumer sentiment echoes past recessions.
High-yield and investment grade bond yield spreads are widening due to higher interest rates.
Balance sheet reduction by central banks may reduce growth as markets lose a valuable source of liquidity.
The prolonged conflict in Ukraine continues to pressure prices of energy and other commodities. It is important to monitor the following:
Inflation signals such as:
- Inventory accumulation
- Commodity prices
- Industrial goods
- Government spending
Economic indicators:
- OAS High Yield spread
- Unemployment
- Case Shiller Index
- Earnings revisionsOur Position
We remain invested selectively in private assets, as private equity and real estate have outperformed other asset classes historically during economic slowdowns.
We continue to seek opportunistic investments, underwriting exit scenarios conservatively and detecting tactical opportunities that protect our investors’ portfolio
We increased our cash allocation significantly
We favor cash-flowing investments, such as private debt, real estate value-add and real estate debt
Disclaimer
This presentation is provided to you by The Family Office Co. BSC(c) (“The Family Office”) for informational purposes only, and contains proprietary information that may not be reproduced, distributed to, or used by, any third parties without The Family Office’s prior written consent.
All information, figures, calculations, graphs and other numerical representations appearing in this presentation have not been audited and may be subject to change over time. Furthermore, certain valuations (including valuations of investments) appearing in this presentation are subject to change as they may be based on either estimates or historical figures that do not reflect the latest valuation. Although all information and opinions expressed in this presentation were obtained from sources believed to be reliable and in good faith, no representation or warranty, express or implied, is made as to their accuracy or completeness. The information contained herein is not a substitute for a thorough due diligence investigation. Past performance is not indicative of and does not guarantee future performance. Exit timelines, prices and related projections are estimates only, and exits could happen sooner or later than expected, or at a higher or lower valuation than expected, and are conditional, among other things, on certain assumptions and future performance relating to the financial and operational health of each business and macroeconomic conditions.
The Family Office makes no representation or warranty, express or implied, with respect to any statistics or historical or current financial data, whether created by The Family Office through its own research or quoted from other sources. With respect to any such statistics or data delivered or made available by or on behalf of The Family Office, it is acknowledged that (a) the investor takes full responsibility for making its own evaluation of the materiality of the information and the integrity of the quoted source and (b) the investor has no claim against The Family Office.
Amounts in currencies other than the US Dollar are translated using prevailing market rates as calculated by The Family Office or its service providers and may differ from the rates used by banks. The rates are indicative only and do not reflect the rates at which The Family Office would be prepared to enter into any transactions with other parties.
Certain information contained in this presentation constitutes “forward-looking statements,” which can be identified by the use of words such as “may,” “will,” “should,” “expect,” “anticipate,” “project,” “plans,” “estimates,” “intend,” “continue,” or “believe” or the negatives thereof or other variations thereon or comparable terminology. To the extent this presentation contains any forecasts, projections, goals, plans and other forward-looking statements, such forward-looking statements are inherently subject to, known and unknown, significant business, economic, competitive, regulatory and other risks, contingencies and uncertainties, most of which are difficult to predict and many of which are beyond The Family Office’s control and may cause actual performance, financial results and other projections in the future to differ materially from any projections of future performance, results or achievements expressed or implied by such forward-looking statements. Investors should not place undue reliance on these forward-looking statements. The Family Office undertakes no obligation to update any forward-looking statements to conform to actual results or changes in The Family Office’s expectations, unless required by applicable law.
The Family Office makes no representation or warranty, express or implied, with respect to any financial projection or forecast. With respect to any such projection or forecast delivered or made available by or on behalf of The Family office, it is acknowledged that (a) there are uncertainties inherent in attempting to make such projections and forecasts, (b) the investor is familiar with such uncertainties, (c) the investor takes full responsibility for making its own evaluation of the adequacy and accuracy of all such projections and forecasts so furnished to it and (d) the investor has no claim against The Family Office.
This presentation represents a summary of certain information, the full terms of which are contained in a Private Placement Memorandum that should be reviewed for a more complete understanding of the investments and their risks. In addition, this presentation does not constitute an offer to sell, or a solicitation to buy, any instrument or other financial product, nor does it amount to a commitment by The Family Office to make such an offer at present or an indication of The Family Office’s willingness to make such an offer in the future.
The Family Office is a Category 1 Investment Firm regulated by the Central Bank of Bahrain C.R.No.53871 dated 21/6/2004. Paid Up Capital: US$10,000,000. The Family Office only offers products and services to ‘accredited investors’ as defined by the Central Bank of Bahrain.